What do you need?
N1MM Rotor Server runs on a small Linux computer that you leave permanently on in your shack. It sits between your rotor controllers and your network, so N1MM Logger can control your antennas from any PC in the house.
A Raspberry Pi is a great choice for this — it's cheap, compact, completely silent, and uses as much power as a phone charger. But any PC or mini-PC running a Debian-based Linux such as Ubuntu or regular Debian works just as well.
- A Raspberry Pi (3B, 4, or 5) — or any other PC running Debian-based Linux
- The Linux system connected to your home network via a network cable
- One USB port per rotor controller, with a USB-to-serial adapter
- A browser on your regular PC, tablet, or phone to access the web interface
Installing
Installation is a one-time job. Copy the package to the Linux system, run one command, and you're done.
Three steps — done in about a minute
Get the source onto the Linux system
Clone the repository from GitHub, or download it as a ZIP from the Download page and copy it to your Linux system.
git clone https://github.com/PA5DJ/N1MM-Rotor-Solution.gitRun the installer
Go into the cloned folder and run the install script:
cd N1MM-Rotor-Solution/N1MM_Rotor_Server/LINUX/src
sudo bash install.sh
The installer compiles the software, sets everything up, and starts the server automatically. This takes about a minute.
Open your browser — done
On any PC, tablet, or phone on your network, open a browser and go to the IP address of the Linux system — for example http://192.168.1.50. The web interface appears immediately.
What gets installed, and where?
The installer takes care of everything. Here is what it puts on the system, so you know what's running:
| Rotor server | The main program. It talks to your rotor controllers through the USB cables and sends heading information to N1MM Logger over the network. It starts automatically whenever the Linux system boots, so you never need to start it manually. |
| Web server | A small web server that serves the web interface on port 80 — the standard web port, so you can reach it just by typing the IP address into your browser without any port number. Also starts automatically on boot. |
| Settings | All settings are saved on the Linux system. You never need to edit them by hand — the web interface handles everything. |
| Log | The server keeps a log of everything it does — rotor movements, wind data, storm events. The log is visible in the web interface and automatically keeps the last 24 hours. Older entries are removed automatically. |
| Wind history | 48 hours of wind and weather readings are stored and shown as graphs in the web interface. |
sudo bash update.sh. All your settings and rotor configurations are kept.
Opening the web interface
Type the IP address of the Linux system into your browser — for example http://192.168.1.50. The Rotors tab opens straight away. On a fresh install a small setup dialog offers to create the first admin account — you can also skip it and keep the interface open to everyone on your network.
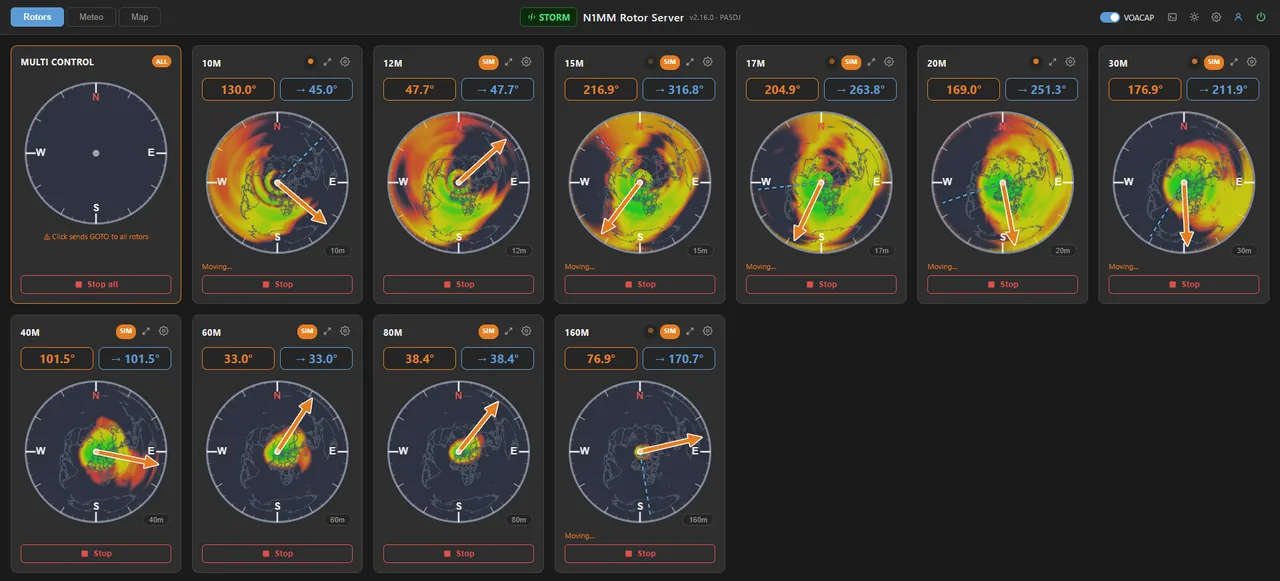
The web interface — one compass card per rotor, with a live heading needle and (optionally) the VOACAP propagation map for the antenna's band under the rose. The STORM badge in the header lights up when storm correction is active.
The interface works on any browser and on any device — desktop, laptop, tablet, or phone. Nothing to install on the device you use to access it — though on a phone you can install it as an app: the dashboard is a PWA, so "Add to home screen" gives it its own icon and a fullscreen window.
Rotors tab
This is the main view. You see a compass card for each of your configured rotors. The needle moves in real time as the antenna turns.
- Click on a compass card to type in a heading and send the rotor there
- Double-click directly on the compass to move the rotor immediately to that bearing
- Press Stop to halt the rotor immediately
- The expand icon on a card opens that rotor fullscreen — ideal on a phone
- With the VOACAP overlay enabled, each compass shows the live propagation map for the antenna's band; a band chip on the compass cycles the band on multi-band antennas
- If you have more than one rotor, the Multi Control card at the top-left lets you send the same heading to all rotors at once
- The card order is yours to choose — move rotors up/down with the arrows in Settings → Rotors
When N1MM Logger sends a heading command — for example when you click a callsign — the compass cards update automatically and the rotors start moving.
Meteo tab
The Meteo tab shows live weather information. This data drives the storm protection: when the wind gets too strong the server automatically parks your antennas.
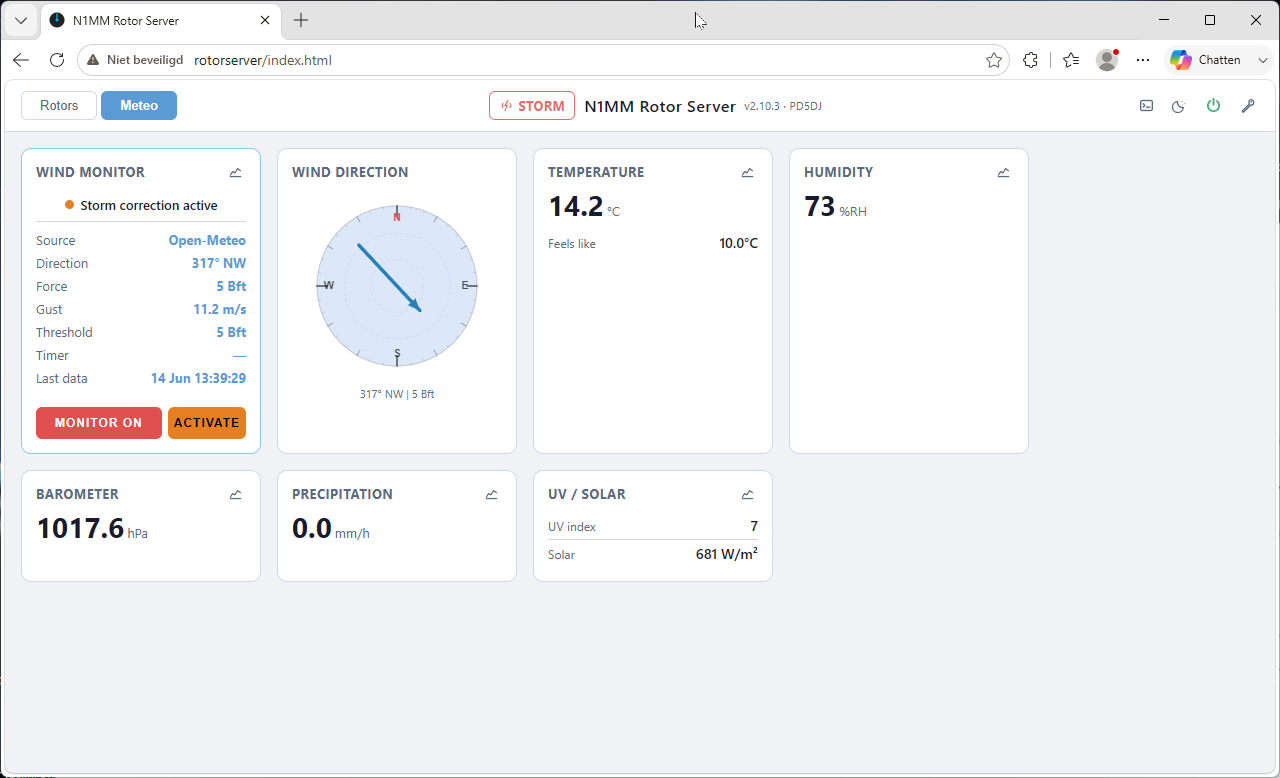
The Meteo tab with Open-Meteo as source. The Wind Monitor card on the left shows the current reading, source, and storm threshold. The compass rose shows the wind direction. Click any card to see its 48-hour history.
You can see the wind direction, wind force in Beaufort, gust speed, temperature, humidity, air pressure, UV index, and solar radiation — depending on what your chosen weather source provides.
Click on any weather card to open a graph showing the last 48 hours of that value. Use the buttons at the top to zoom in to 30 minutes, 1 hour, 3 hours, 6 hours, or further back.
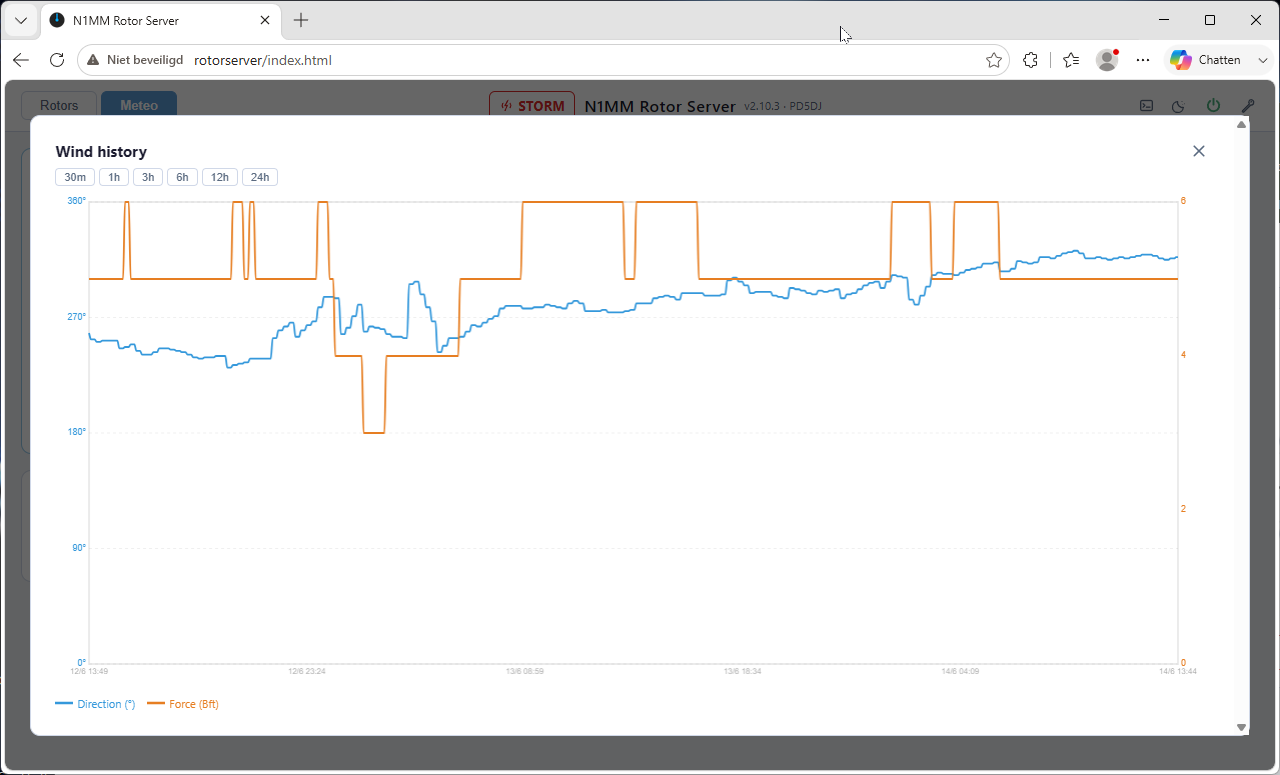
The wind history popup. Blue line = direction, orange line = Beaufort force. The regular steps in orange show the rotor being periodically sent back to its safe storm heading.
Map tab
The Map tab shows a live site plan of your antennas. Each rotor is drawn at its real position, with a colored direction line showing where the antenna is pointing right now. The lines move in real time as the rotors turn — a quick glance tells you exactly where every antenna is aimed.
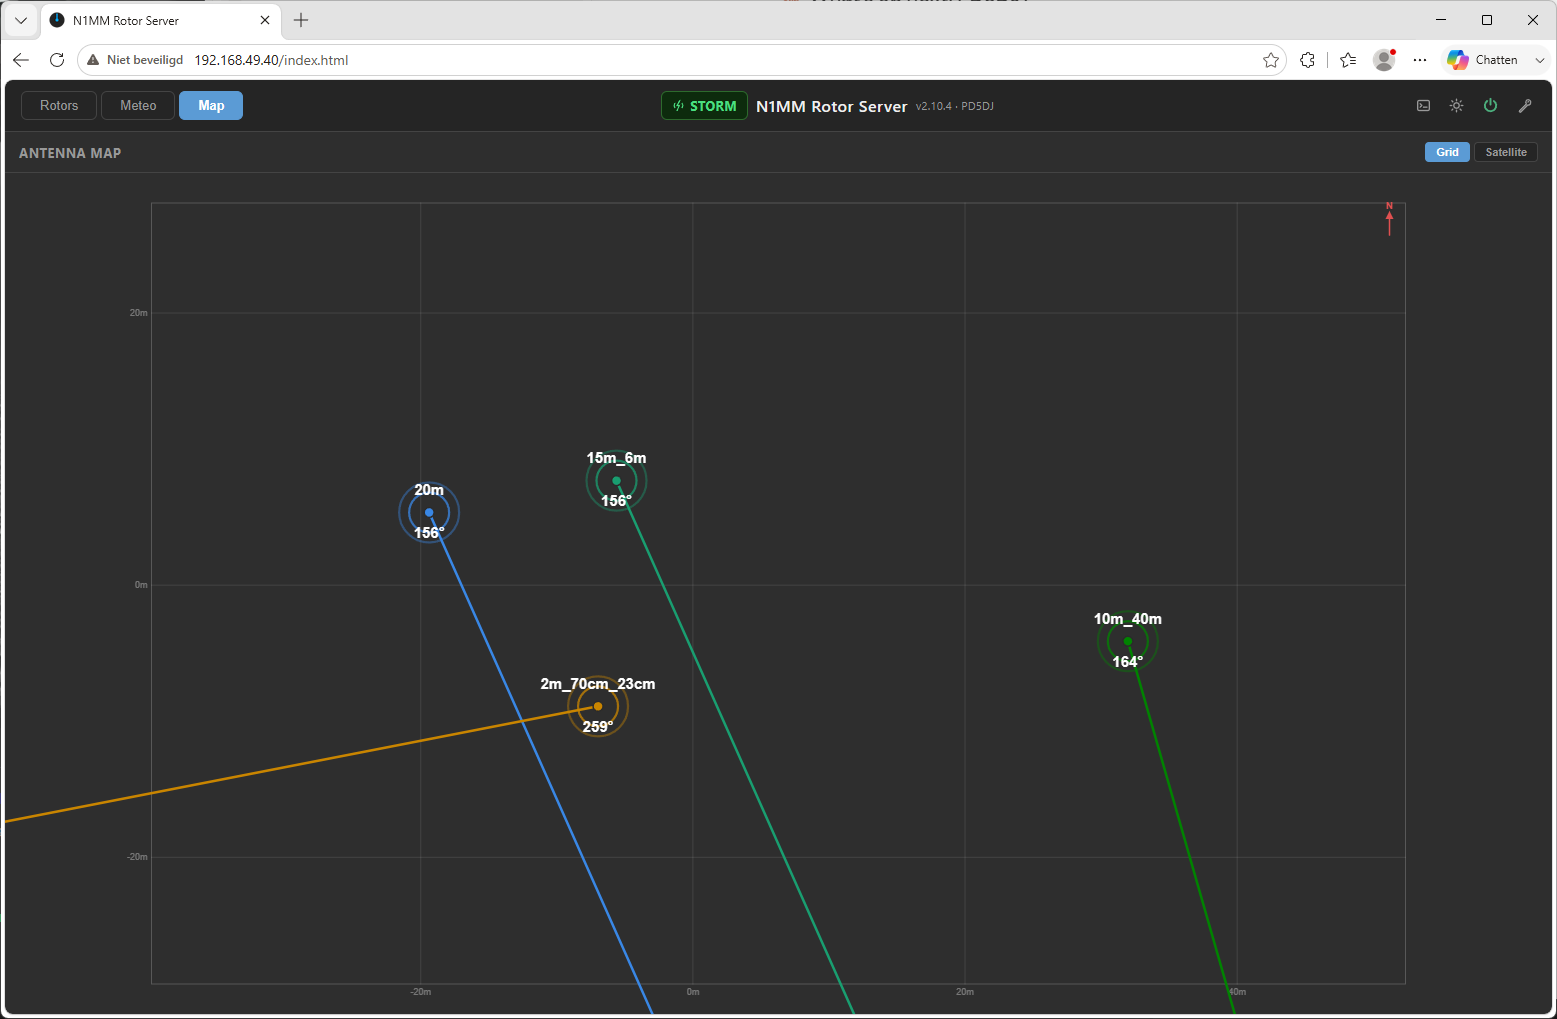
Grid view — a clean site plan with a meter grid and north arrow. Each antenna shows its name and current heading, and the direction line follows the rotor live.
There are two views, switchable with the buttons in the top-right corner:
- Grid — a schematic plan on a meter grid with a north arrow. Works entirely offline.
- Satellite — the same antennas and direction lines drawn on top of Esri World Imagery satellite tiles, so you see your actual QTH from above. Requires an internet connection for the map tiles.
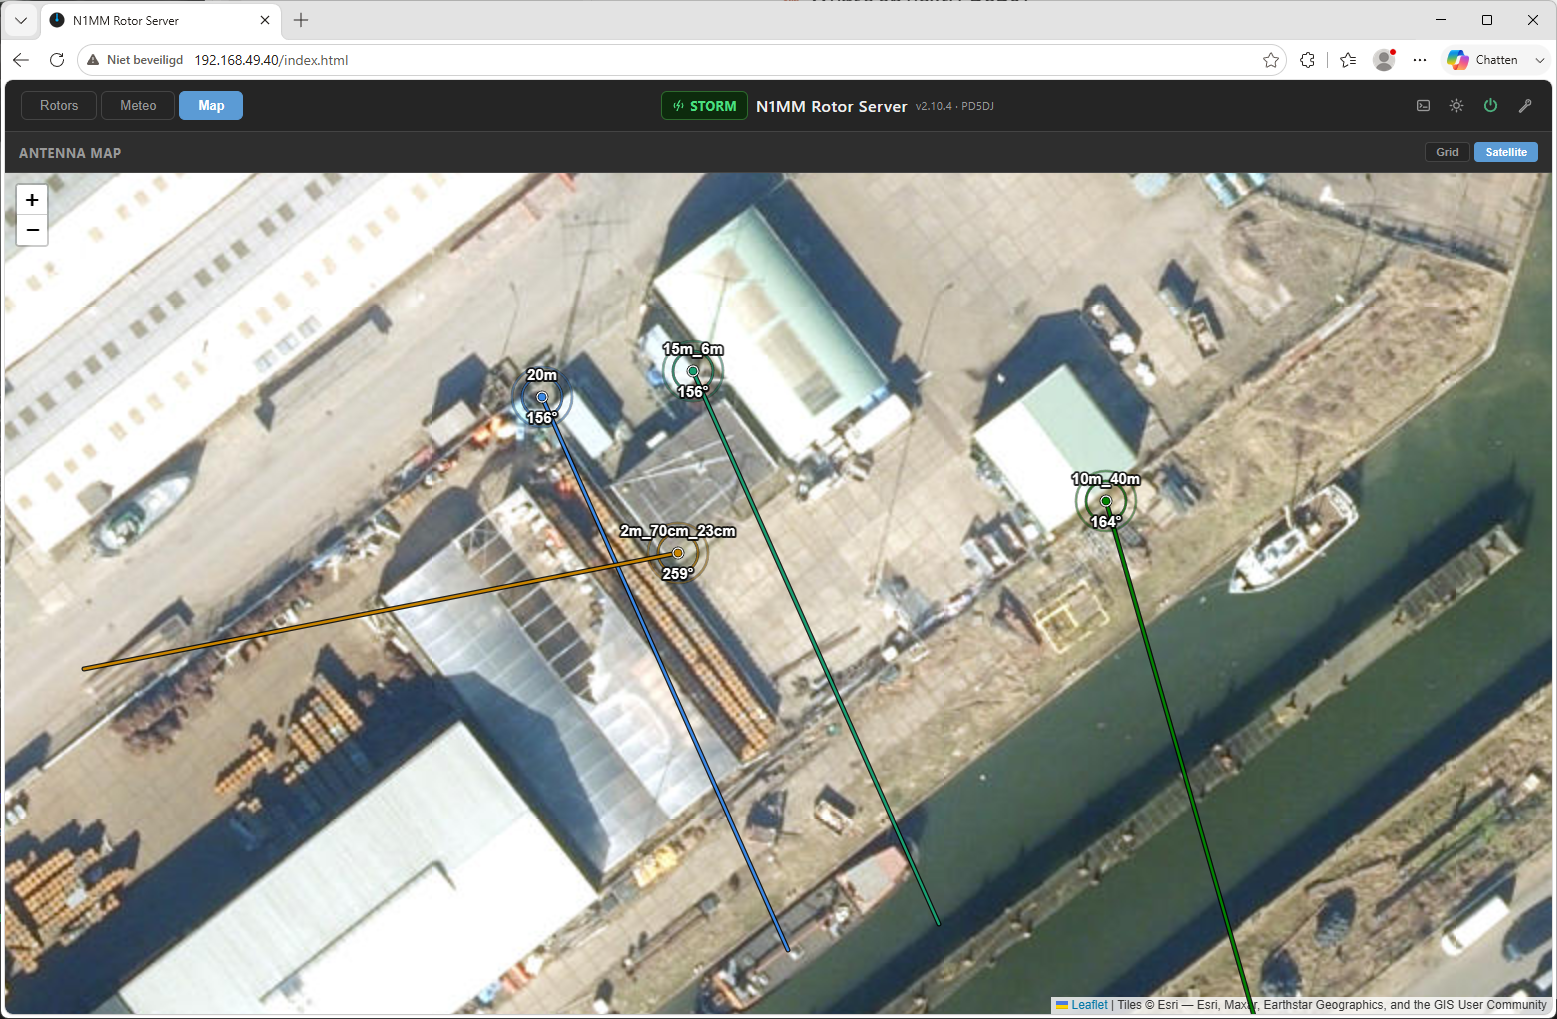
Satellite view — the antennas plotted on aerial imagery of your own QTH. Zoom and pan freely; the direction lines keep their real-world length at every zoom level.
To place your antennas on the map, enter the GPS coordinates (latitude/longitude) of each rotor in Settings → Rotors. You can also set the length of the direction line in kilometers per rotor — handy to tell a long HF beam apart from a small VHF yagi, or to draw a long bearing line towards a distant target. Your view choice (Grid or Satellite) is remembered by the browser.
Settings
Click the gear icon in the top-right corner to open the Settings panel. There are up to seven tabs — Rotors, Server, Meteo, Storm, Web, Accounts, and SMTP — depending on your role (managers see the day-to-day tabs, admins see everything). Make your changes and click Save & restart server. The server restarts in a few seconds and the page reconnects on its own — you don't need to do anything.
Settings — Rotors
This is where you tell the server about your rotor controllers. You add each one with a name, tell the server which USB port it's on, and select the right communication settings for your controller model.
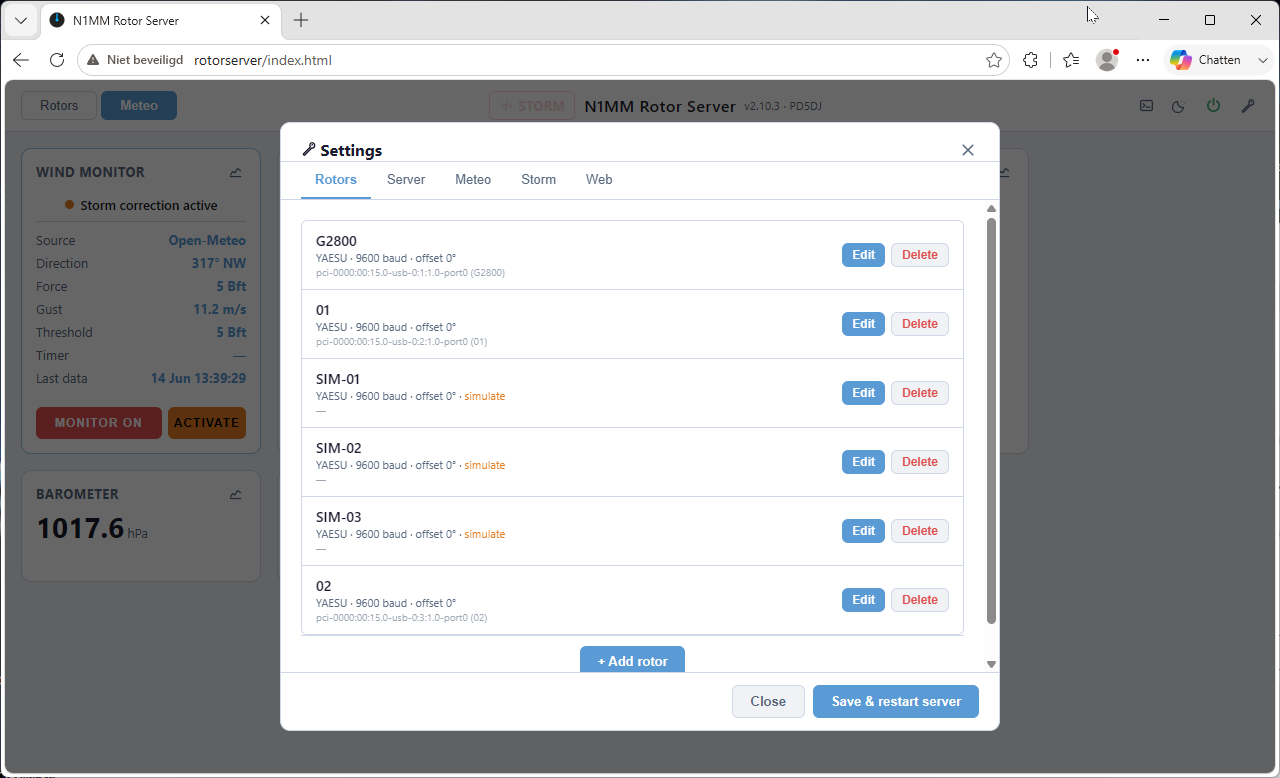
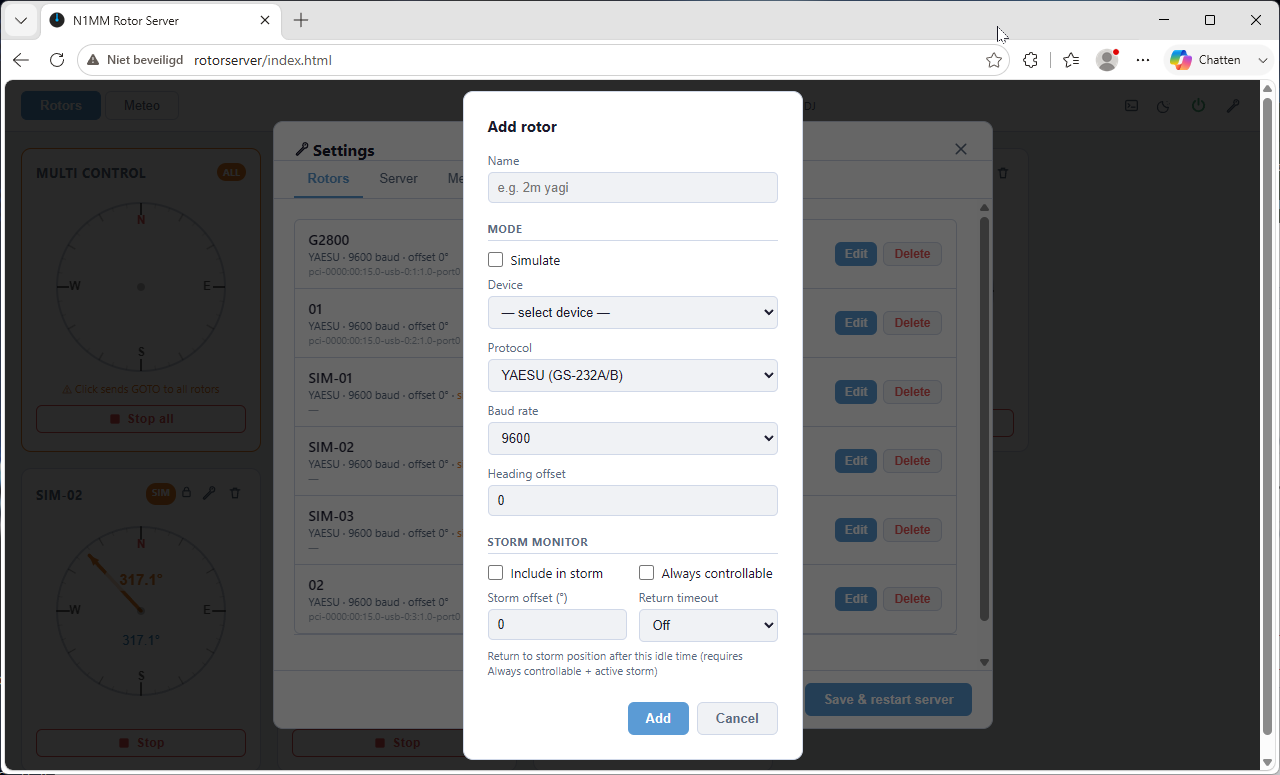
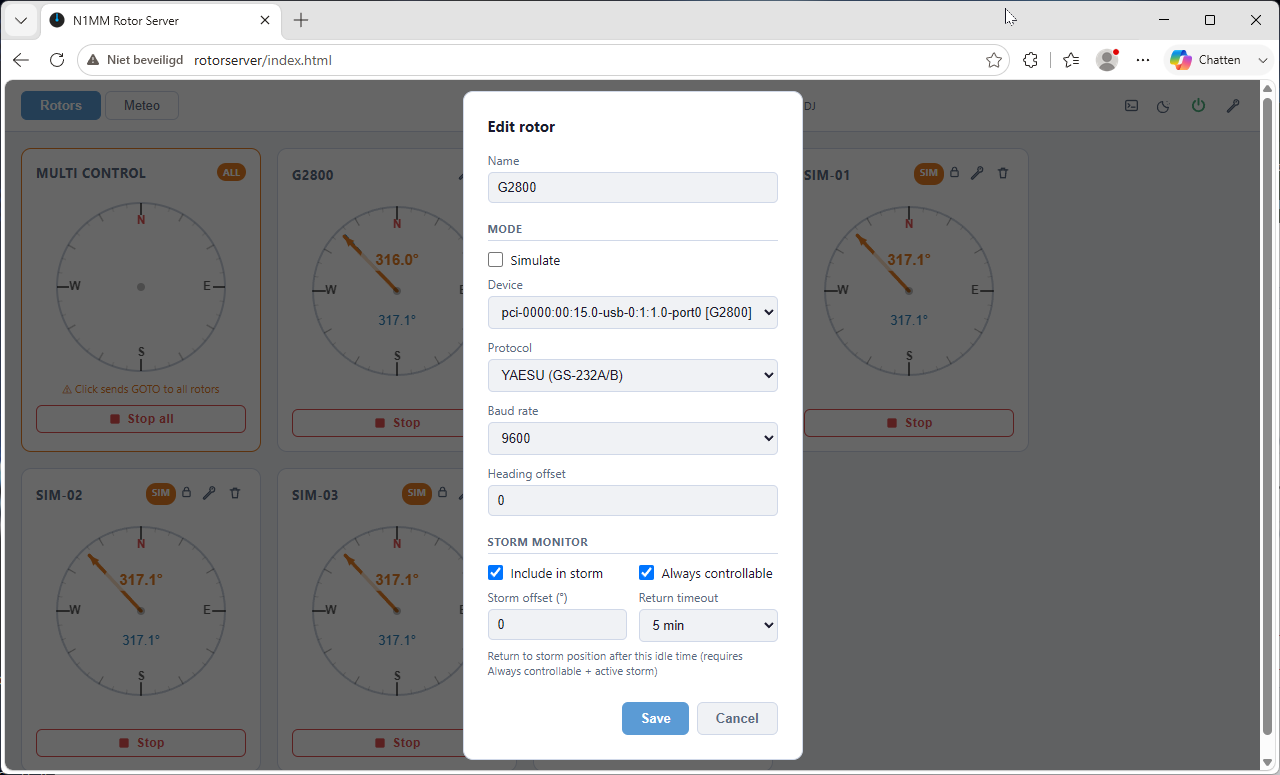
Editing an existing rotor. The USB port dropdown shows which ports are already in use by other rotors, so you can't accidentally assign the same port twice. The rotor name also appears in N1MM Logger — so it must match exactly.
At the bottom of the rotor dialog you find the Storm Monitor settings. These control what happens to this specific rotor when a storm is detected:
- Include in storm — tick this if you want this rotor to be parked automatically when it storms. Leave it off for rotors you prefer to control manually regardless of the weather.
- Storm offset — by default the rotor is parked pointing into the wind. With an offset you can shift that by any number of degrees. For example, +90° parks the antenna sideways to the wind instead.
- Always controllable — normally storm protection locks out commands from N1MM Logger. Tick this to keep the rotor manually controllable via N1MM even during a storm.
- Return timeout — if Always controllable is on and you manually move the rotor during a storm, it will automatically return to the safe storm heading after this many minutes of inactivity. Useful to make sure the antenna doesn't stay in an unsafe position if you forget about it.
The rotor dialog also has Map position fields: the GPS latitude/longitude of the antenna and the length of its direction line in meters. These place the rotor on the Map tab — leave them at 0 if you don't use the map. Below that you tick the bands the antenna covers and the bands for the VOACAP propagation overlay.
Back in the rotor overview, the ▲/▼ arrows next to each rotor set the order of the compass cards on the dashboard. Move the rotors into the order you like, save, and every open dashboard re-arranges itself — no reload needed. At the bottom of the Rotors tab you'll also find the global VOACAP overlay settings (on/off, transmit power, mode, and the propagation server to use).
Settings — Server
These settings control how the server communicates with N1MM Logger and other applications on your network. For most home shack setups the default values work without any changes.
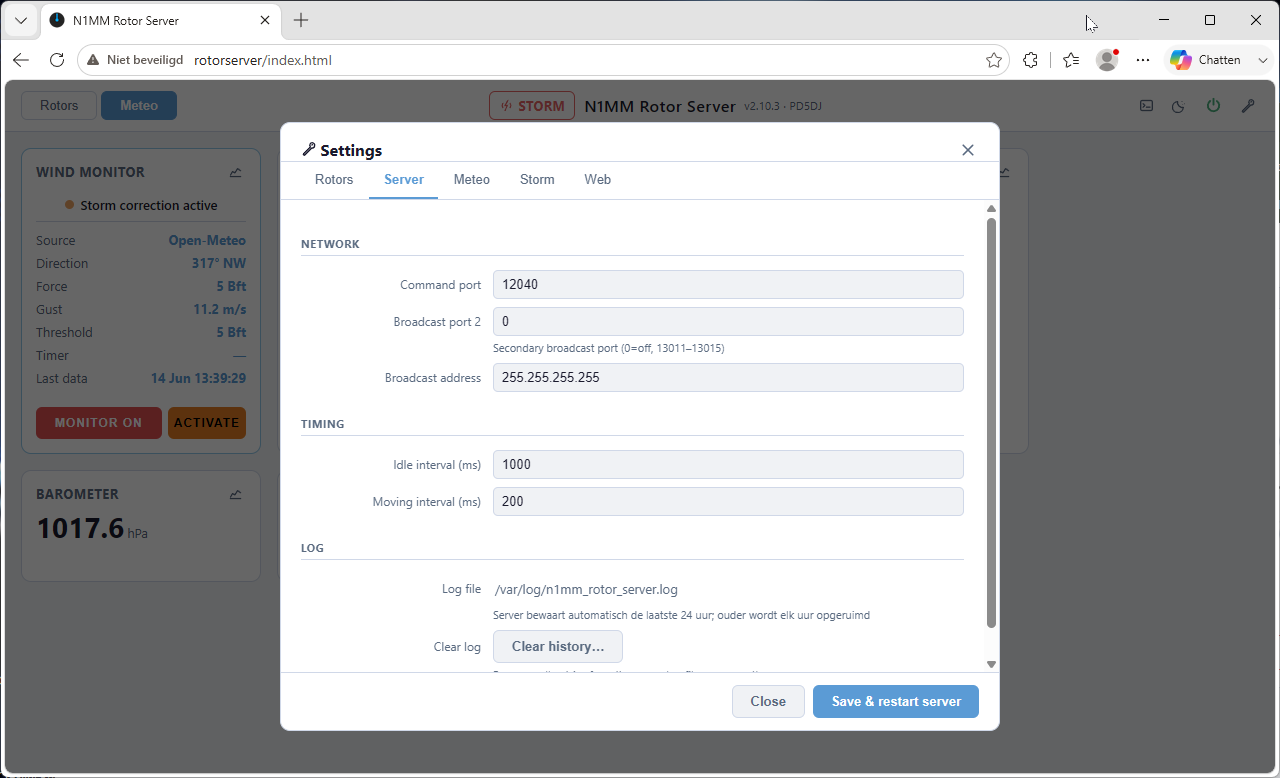
Settings → Server. Network ports and timing. The defaults work for the vast majority of setups.
How does the communication work? N1MM Logger sends a heading command to the server ("point rotor X to 270°"). The server moves the rotor and continuously sends the current heading back to N1MM Logger so the display stays up to date. Both directions use UDP — a lightweight network protocol well-suited for this kind of real-time data.
Command port (default: 12040)
The server listens on this port for incoming commands from N1MM Logger. This is the port you enter in N1MM Logger when you configure the rotor connection. You only need to change this if port 12040 is already in use for something else on your network.
Broadcast address
This is how the server sends the current rotor heading back to N1MM Logger — and to any other application that wants to listen. Instead of sending to one specific PC, the server sends a single message to the whole network at once. Every device on the network receives it, and N1MM Logger picks it up automatically.
The broadcast address is always your network address with 255 as the last number. If all your devices have addresses like 192.168.1.x, your broadcast address is 192.168.1.255. The default value 255.255.255.255 is a shorthand that reaches every device on every connected network, which works fine in a typical home setup.
If your shack runs on a separate network from the rest of your home — for example the rotor server is on 192.168.1.x and your PC is on 10.0.0.x — you can enter both broadcast addresses separated by a comma.
Broadcast port (default: 13010)
The port on which position updates are sent out to the network. N1MM Logger listens on this port. Only change this if you have a specific reason to.
Secondary broadcast port
If you run a second application that also needs to receive rotor position updates — for example N1MM Rotator Client running on a second PC in the shack — you can enable a second broadcast port here. The server then sends the same position data on both ports at the same time. Configure the second application to listen on this second port, and both will stay in sync automatically. Leave this at 0 if you only use N1MM Logger.
Poll intervals
The server regularly asks each rotor "what is your current heading?" so it can keep the display up to date. When a rotor is not moving, it checks once per second (1000 ms). When a rotor is moving it checks much more often — every 200 ms — so the compass needle moves smoothly. You don't need to change these.
Settings — Meteo
Choose where the server gets its wind and weather data. The data is used for the storm protection system and displayed on the Meteo tab.
- Open-Meteo — a free internet weather service. No account needed, works immediately. This is the best starting point for most users.
- yr.no — the Norwegian Meteorological Institute. Also free and requires no account.
- OpenWeatherMap or WeatherAPI — free accounts with an API key. Useful if you prefer a different data source.
- Ecowitt weather station — if you have a personal weather station in or near your shack that supports the Ecowitt protocol, the server can receive live data directly from it over your home network. This gives you real local wind readings instead of an internet forecast, which is far more accurate for storm protection.
- Serial wind sensor — a USB anemometer or wind sensor connected directly to the Linux system.
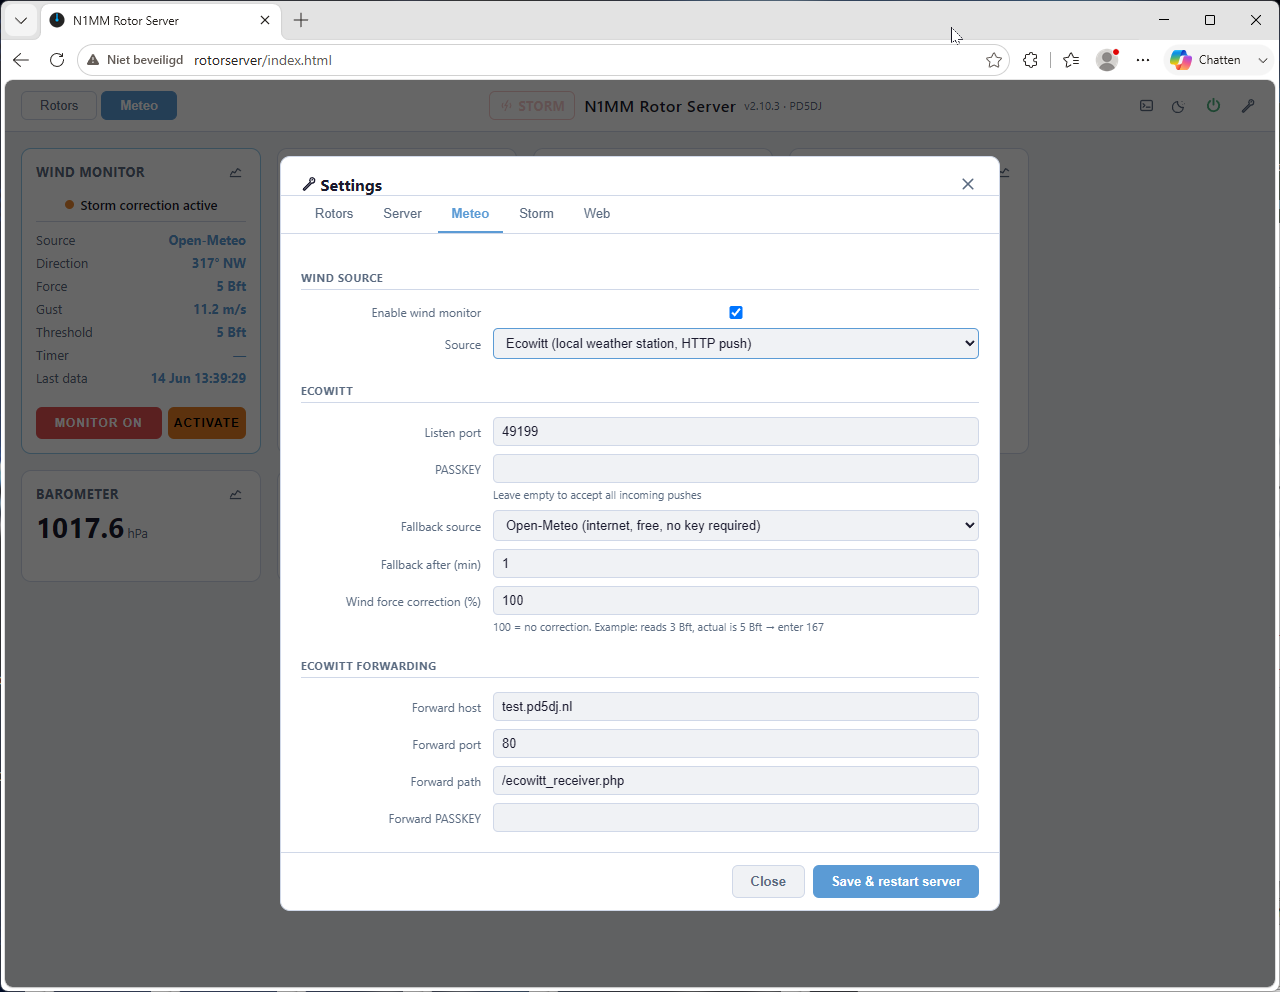
Settings → Meteo with Ecowitt selected. The station sends data to the server over the local network. If the station stops sending, the server automatically falls back to an internet source so storm protection keeps working.
Settings — Storm
Storm protection watches the wind continuously. When the wind gets too strong, the server automatically turns all your antennas to a safe position so they don't get damaged. When the wind drops back down, the antennas are released and N1MM Logger can control them again as normal.
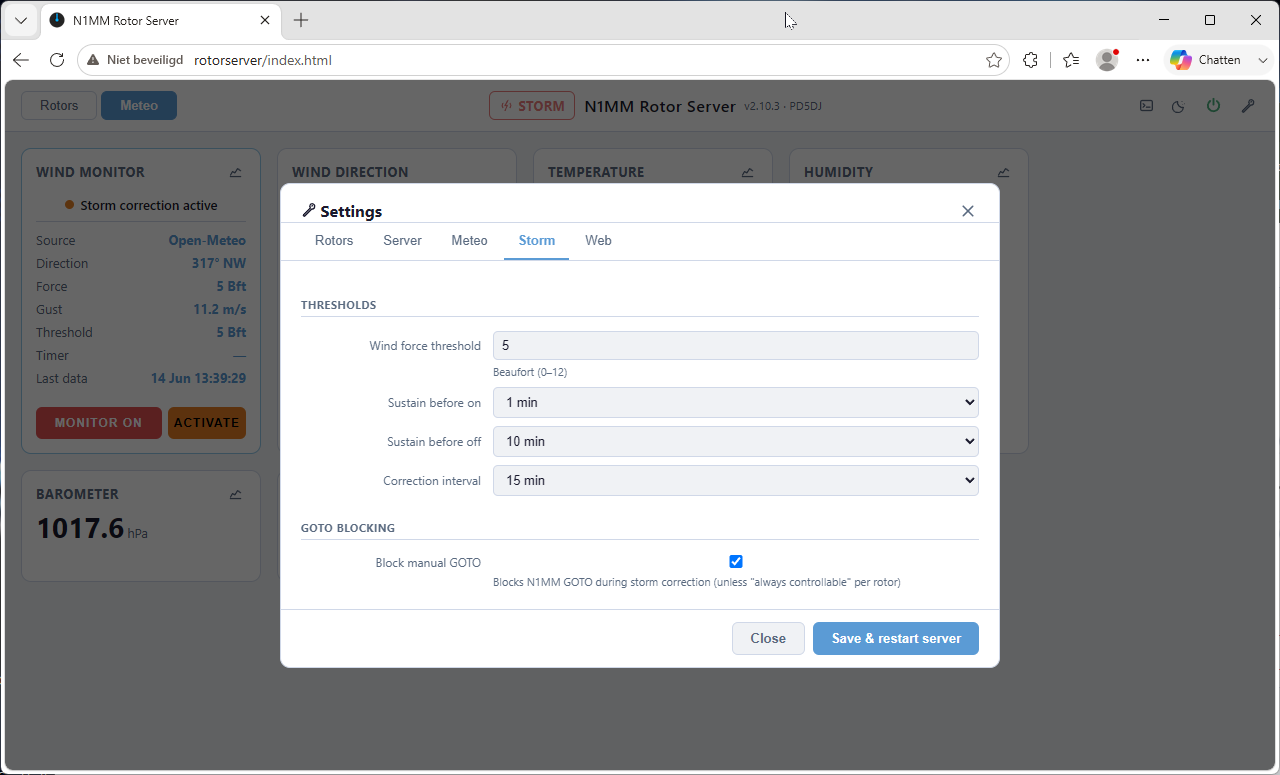
Settings → Storm. Here you set the wind strength threshold and the timers that prevent false triggers from short gusts.
- Wind force threshold — the wind strength at which protection kicks in, measured in Beaufort. Beaufort 5 is a fresh breeze, 6 is a strong breeze, 7 is near gale. Set this to whatever wind level you consider unsafe for your antennas.
- Sustain before on — the wind needs to stay above the threshold for this many minutes before antennas are moved. This prevents a short gust from triggering an unnecessary rotation. For example: set to 2 minutes and a single gust above the threshold will be ignored, but a sustained strong wind will trigger protection.
- Sustain before off — once the storm is over, the wind needs to stay below the threshold for this many minutes before the antennas are released again. This prevents the antennas from being moved back and forth during a storm that is passing through.
- Correction interval — during an active storm, the server periodically re-sends the "go to safe heading" command to each rotor. This is a safety net in case a rotor drifted slightly. The default is every 15 minutes.
- Block manual GOTO — when this is on and a storm is active, heading commands from N1MM Logger are ignored. The antennas stay in their safe position. You can override this per rotor with the "Always controllable" option.
You don't need to go into settings to switch storm protection on or off. On the Meteo tab, the Wind Monitor card has a button to enable or disable it instantly, and an Activate button to force it on immediately regardless of the sustain timer.
Settings — Web
General web-interface options: the port the web server runs on (80 by default) and the session idle timeout — how long a login stays valid without activity. Ticking Remember me on the login dialog keeps a login valid for 30 days instead, even across server restarts.
setup_ssl.sh script puts nginx in front of the web server with a free Let's Encrypt certificate (automatic renewal included). Run it once with your domain name and the dashboard is reachable over https://.
Settings — Accounts
By default the web interface is open to anyone on your local network. If you want logins, create accounts here (up to 8) — each with a name, e-mail address, and one of three roles:
- User — may control the rotors (GOTO/STOP), but not while storm correction is active, and sees no settings.
- Manager — day-to-day operation: rotor control (also during a storm), storm on/off, and the Rotors/Meteo/Storm settings tabs.
- Admin — everything, including accounts, server & SMTP settings, and restart/reboot/shutdown.
Per-role permission checkboxes let you fine-tune this — for example giving managers the power buttons, or taking storm control away from users. When you add an account (or reset its password), the server e-mails a temporary password; the user must pick their own password at first login. There's also a public "Forgot password" link on the login dialog that mails a new temporary password.
N1MM Logger itself connects directly over UDP and is never affected by web logins — it keeps working regardless.
Settings — SMTP mail
To let the server send e-mail — account passwords and event notifications — enter your SMTP provider here: host, port, security (SSL / STARTTLS / none), login, and the From/To addresses. A Send test mail button verifies the settings on the spot.
Pick which events should trigger a notification mail: storm correction start/stop, wind-source failover, a rotor losing or regaining its connection, and server start. The mails are neatly formatted HTML, and when you fill in the Server URL field every mail gets a one-click "Open dashboard" button.
VOACAP propagation overlay
Where is the band open right now? With the VOACAP overlay enabled, every compass card shows the live propagation prediction for that antenna's band, drawn under the rose: your station is at the centre, the edge of the circle is the opposite side of the earth, and the colours show where your signal is predicted to arrive. Point the needle into the bright area and you're pointing at the opening.
- Enable it in Settings → Rotors (bottom section): overlay on/off, your transmit power, and the mode (CW, SSB, FT8, FT4, or WSPR — the prediction accounts for how much signal each mode needs).
- Per rotor, tick the overlay bands in the rotor edit dialog. A multi-band antenna gets a small band chip on its compass — click it to cycle through the bands.
- The VOACAP switch in the header turns the overlay on or off for your own browser without touching the configuration.
- Maps refresh automatically every hour in the background and are cached on disk — page loads and even server restarts never cause needless re-downloads.
By default the predictions come from the free, donation-run Open HamClock Backend. Prefer to be fully independent? Run sudo bash setup_prop.sh once: it builds a complete local VOACAP engine on the same machine (free and open source, no subscriptions) and switches the server over to it. The installer also offers this as an optional extra at the end of a fresh install.
Log viewer
Click the terminal icon in the top-right corner to open the log panel. It shows everything the server has been doing over the last 24 hours and updates live as new events happen. This is useful if something isn't working as expected — you can see exactly what the server did and when.
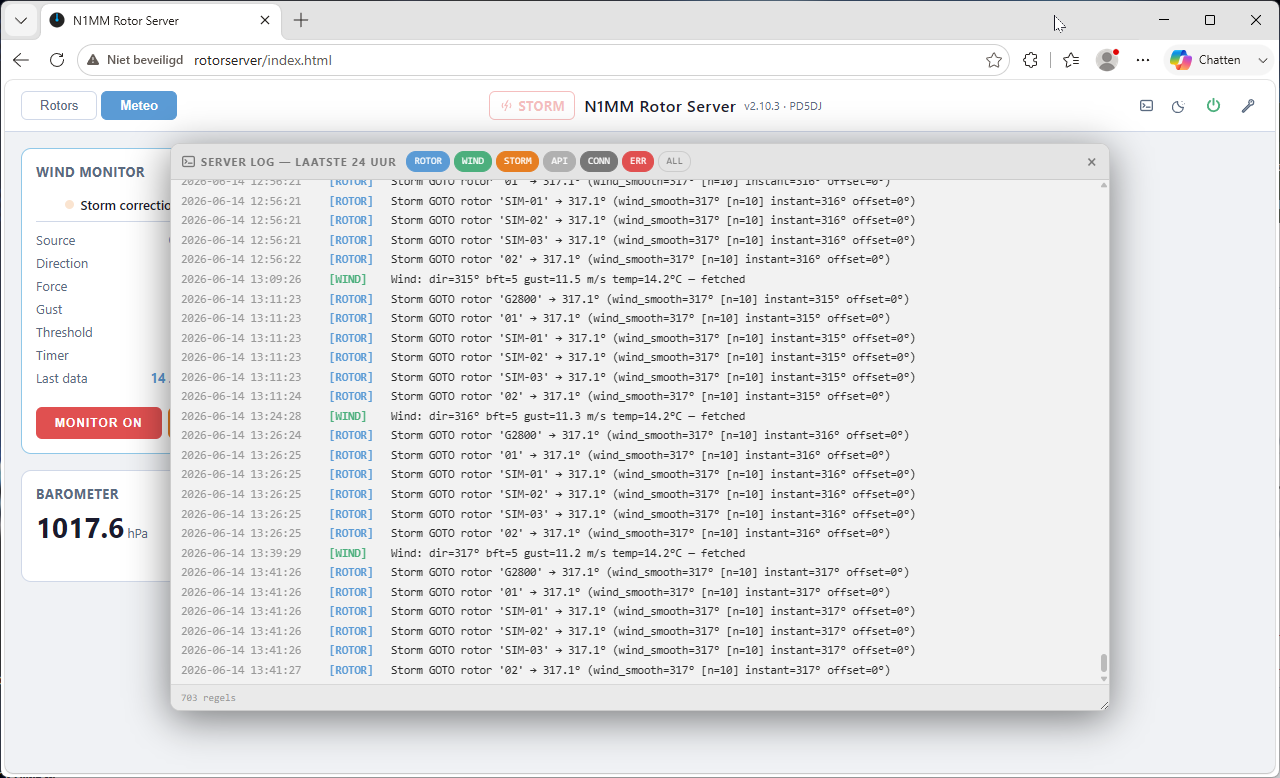
The log panel. Use the coloured filter buttons to show only what you're interested in — for example STORM to see when storm correction activated, or ROTOR to see every heading command that was sent.
A red dot on the terminal button means there are error entries in the log. Click the button to open the log and filter on ERR to see what went wrong.
Connecting N1MM Logger
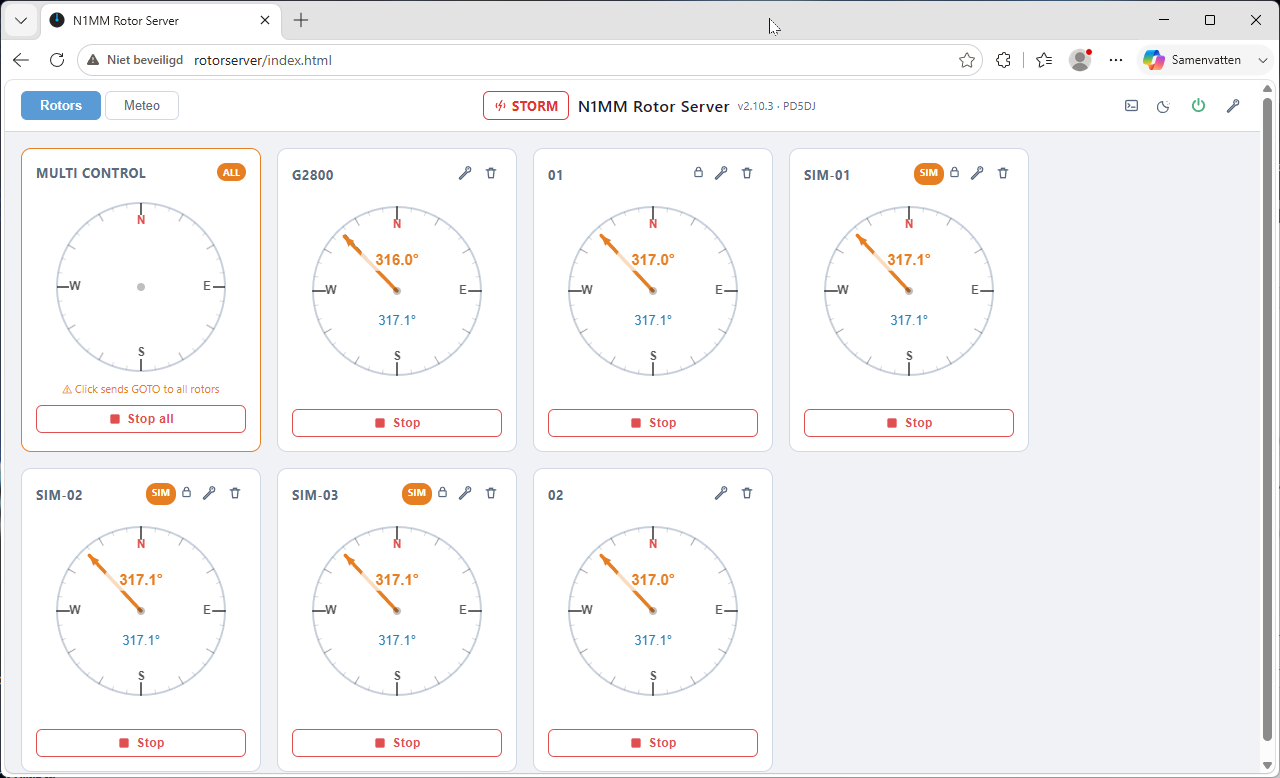
When N1MM Logger sends a heading command, the compass cards update immediately and you can watch the needle moving as the antenna turns.
In N1MM Logger+, go to Config → Configure Ports, Mode Control, Winkey… and open the Rotor tab. For each antenna you want to control:
- Set the Rotor name — this must be exactly the same as the name you gave the rotor in N1MM Rotor Server, including capitals. If the names don't match, N1MM Logger and the server won't connect the rotor to each other.
- Set Rotor type to N1MM Rotor
- Enter the IP address of the system running N1MM Rotor Server — the same address you use to open the web interface
- Leave the ports at their default values (12040 and 13010) unless you changed them in the server settings
Save the settings in N1MM Logger. From that point on, N1MM Logger will automatically rotate your antennas when you work a new station, and the web interface will show the heading updating in real time.
Something not working?
The web interface doesn't open in my browser
- Make sure the address starts with
http://and nothttps://— out of the box the server uses a plain connection (HTTPS is available via the optionalsetup_ssl.shscript) - Double-check the IP address — look it up in your router's device list again to make sure it hasn't changed
- Make sure the Linux system is powered on and the network cable is plugged in
- Try the address from a different device to rule out a browser issue
A rotor shows as disconnected in the web interface
The server can't reach the rotor controller through the USB cable. Check the following:
- Is the USB adapter plugged into the same physical USB port as when you set it up? The server identifies USB devices by their physical port position, so plugging into a different port looks like a different device.
- Is the rotor controller powered on?
- Is the USB cable firmly connected at both ends?
The server tries to reconnect automatically every 5 seconds. Once the connection is restored it picks up again on its own — no restart needed.
N1MM Logger doesn't receive heading updates
- Check that the rotor name in N1MM Logger matches the name in N1MM Rotor Server exactly — including capital letters. "2m Yagi" and "2m yagi" are treated as different rotors.
- Make sure the PC running N1MM Logger and the Linux system are on the same network. If they're on different networks, N1MM Logger won't receive the broadcast messages.
- If you have a more complex network setup with multiple subnets, add the broadcast address for the N1MM Logger PC's subnet in Settings → Server.
Storm protection doesn't activate when the wind is strong
- First check the Meteo tab — is there live wind data showing? Storm protection can't work without wind data. If the Meteo tab shows no data, go to Settings → Meteo and check that wind monitoring is switched on and a source is configured.
- Check that each rotor you want protected has "Include in storm" ticked — go to Settings → Rotors and click Edit on each rotor.
- Remember the sustain timer — the wind needs to be above the threshold for the full "Sustain before on" period before protection activates. If you want to test it right now, use the Activate button on the Wind Monitor card in the Meteo tab to force it on immediately.
No weather data on the Meteo tab
- Go to Settings → Meteo and confirm that "Enable wind monitor" is switched on
- If you're using an internet source (Open-Meteo, yr.no, etc.), the Linux system needs access to the internet. Check that it can reach the internet — try opening a browser on it and loading a website.
- If you're using an Ecowitt station, confirm that the station is set to send data to the IP address of the Linux system on the correct port. See the Ecowitt setup guide in your station's app.
I forgot my password
If SMTP mail is configured, simply use the Forgot password link on the login dialog — a new temporary password is mailed to the address on your account.
Locked out of the only admin account with no mail configured? Log in to the Linux system once (or SSH in) and run:
sudo nano /etc/n1mm_rotor_server/n1mm_rotor_server.confDelete the userN_… lines of the account (name/hash/role/email), save, and restart the web service. The first-run setup dialog then lets you create a fresh admin account from the browser.